Government data is growing at a staggering compounded annual rate of roughly 60 percent per year. iParametrics' Data Analytics team works with government clients to design, develop, and deploy data science, machine learning, deep learning, and other analytics tools that address and solve complex problems. We help our clients better understand their data, transform their data into insight, and support decision-making.
Analytics and Decision Sciences Services:
- Data Science: We provide data science services to help our partners find patterns in data and extract relevant insights by using scientific and statistical methods. The types of tasks our big data specialists solve in data science include data collection, aggregation, analysis and restructuring, model-building, machine-learning/deep learning/artificial intelligence methodologies, and validation, testing and deployment.
- Machine Learning and Deep Learning: We leverage machine learning and deep learning modeling methodologies to develop automated systems focused on improving the efficiency and effectiveness of a range of government agencies. Whether it be planning for and responding to major disasters, or maximizing the effectiveness of military personnel, machine-learning-based systems reduce workload, speed up processes, improve accuracy, and reduce cost.
- Data Visualization: Data visualization is the graphical representation of information and data. Our team develops dynamic mappings, charts, graphs, and reports to provide accessible and intuitive ways to see and understand trends, outliers, and patterns in data to take appropriate action. As a Qlik Certified Partner, we combine Qlik visualization technology with proprietary geospatial and machine-learning-driven techniques. Through a combination of client data assets and many other iParametrics-curated data sources, we generate user-friendly tools that provide insightful analysis of natural hazard exposure, crime, terrorism, and risk profiles for a broad range of regional and local hazard events.
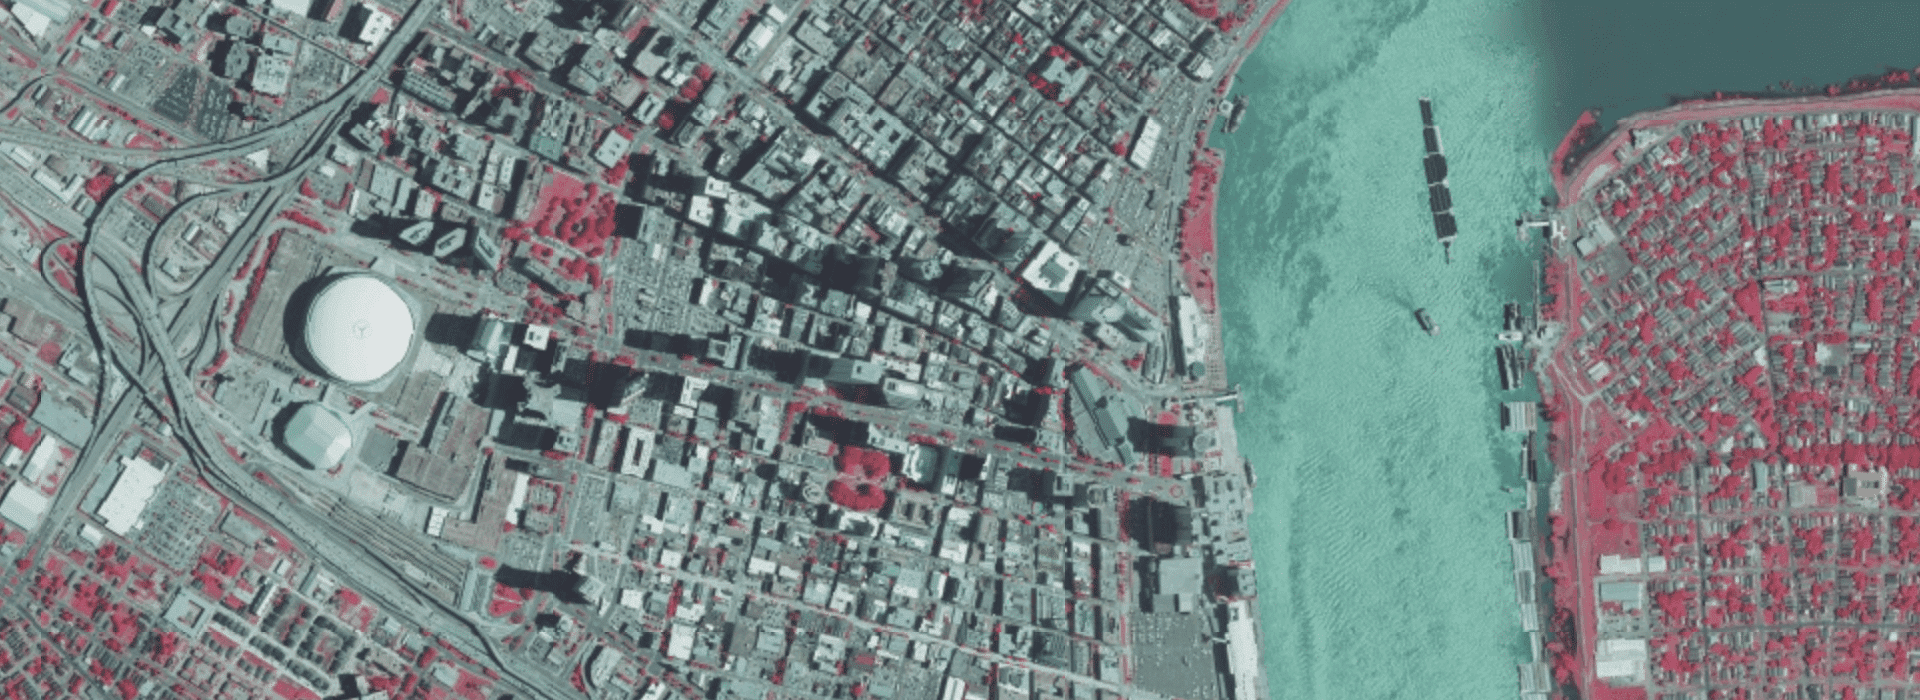
- Geospatial Services: Geospatial analysis is used to analyze data about physical objects that are linked to a geographical location. Data Sources such as imagery, satellite photography, maps and historical conditions (weather, crime, economic, etc.) can be used to describe geographic conditions visually and spatially. If you can account for both time and space in analytics, it enables analysts and decision makers to see another layer of patterns and trends in data which can help build a richer and more complete picture.
Emergency Management & Security
We leverage a range of technology platforms to visually understand the vast and complex world of emergency management and disaster recovery. Historical information provides trends that allow our consultants to identify potential high-risk time periods and high-risk-high-impact structures within a region or zone. This information can be used to proactively prepare for, respond to, and potentially mitigate the depth, duration, and impact of a crisis event and empower decision-making.
Analytics and Decision Sciences Services:
We provide data science services to help our partners find patterns in data and extract relevant insights by using scientific and statistical methods. The types of tasks our big data specialists solve in data science include data collection, aggregation, analysis and restructuring, model-building, machine-learning/deep learning/artificial intelligence methodologies, and validation, testing and deployment.
Machine Learning and Deep Learning
We leverage machine learning and deep learning modeling methodologies to develop automated systems focused on improving the efficiency and effectiveness of a range of government agencies. Whether it be planning for and responding to major disasters, or maximizing the effectiveness of military personnel, machine-learning-based systems reduce workload, speed up processes, improve accuracy, and reduce cost.
Data Visualization
Data visualization is the graphical representation of information and data. Our team develops dynamic mappings, charts, graphs, and reports to provide accessible and intuitive ways to see and understand trends, outliers, and patterns in data to take appropriate action. As a Qlik Certified Partner, we combine Qlik visualization technology with proprietary geospatial and machine-learning-driven techniques. Through a combination of client data assets and many other iParametrics-curated data sources, we generate user-friendly tools that provide insightful analysis of natural hazard exposure, crime, terrorism, and risk profiles for a broad range of regional and local hazard events.
Emergency Management & Security
We leverage a range of technology platforms to visually understand the vast and complex world of emergency management and disaster recovery. Historical information provides trends that allow our consultants to identify potential high-risk time periods and high-risk-high-impact structures within a region or zone. This information can be used to proactively prepare for, respond to, and potentially mitigate the depth, duration, and impact of a crisis event and empower decision-making.
Healthcare
We have developed proprietary machine learning models and algorithms to support human performance and wellness programs across the military. These models support predicting, managing, and optimizing performance for warfighters within the United States military. The tool uses a graphical user interface that allows the user to visualize metrics related to human performance improvement and interventions and then to explore various “what if” scenarios. We have applied machine learning approaches to determine which performance indicators, out of hundreds, were most highly correlated with positive outcomes. The tool evaluates specific performance metrics, and therapeutic regimens with respect to injury and disability across time, with the goal of determining which actions have the greatest positive impact on improvements in human performance across these multiple dimensions.